 Right off the bat, let us try and answer this question.
What is the difference between Quality Assurance and Quality Control?
Assuring that processes and methodologies used on the project are in line with those prescribed by the organization by means of quality audit; and getting feedback for improvements on organizational quality processes is all that you do in Quality Assurance activities.
Controlling quality on the deliverables, by means of running tests, identifying defects and raising change requests – are what you do in Quality Control activities.
Like all other project management domain knowledge areas, you need a plan that ensures quality of project deliverables can be met. This plan talks about quality requirements and standards to be used to assess quality of deliverables as per documented requirements and to show how the project demonstrates this quality compliance. This plan is called Quality Management Plan – and is the primary outcome of this project management activity.
If the performing organization does not contain a quality policy, then project management team can come up with one and propose it to be the organizational policy. This would be then strengthened and formalized through quality assurance processes on various projects.
What do I need?
Project management plan, of course.
Quality planning is not done as an isolated exercise. It is done in parallel with other planning processes, and hence some of the other plans that may have impact are studied as well.
Requirements management plan show how requirements are collected and managed, so we can understand how quality could be ensured right while requirements are managed.
Similarly, we study risk management plan because certain risks can have major impact on product quality.
Then it is important to understand what are stakeholder expectations and needs, and how stakeholders are engaged, hence stakeholder management plan helps in this respect.
Scope baseline
- Project scope document – contains the project description, major deliverables, acceptance criteria and so on.
- Work breakdown structure and details – scope broken down into smaller packages
Stakeholder register
Why should stakeholder register be required as an input to Plan Quality process?
Stakeholder register contains information about people, their position in the organization, role in the project and particular interests in the project including expectations on quality of deliverables. These are to be studied to make sure that stakeholders expectations and needs are met through quality management activities.
Risk register
This contains information about threats and opportunities, which may impact quality requirements.
Requirements documentation & traceability matrix
Stakeholder’s needs are documented here, which include quality requirements as well. These need to be studied in order to satisfy them in project deliverables. Traceability matrix shows the link between a requirement to deliverable all through different aspects of conversion such as WBS, cost, and test cases.
Others
Any regulations put forth by industry (example: HIPAA in Healthcare) or government (example: environmental clearance for infrastructure projects), organizational policies and procedures related to quality, quality metrics from earlier projects, lessons learned and tips from earlier projects.
By now you probably realize that all the planning processes can do with a little help (or constraints!) from Enterprise Environmental Factors and Organizational Process Assets!
How do I do this?
Expert judgment
..by functional experts, subject matter experts, internal quality experts, and even quality consultants is essential to come up with tools, checks, balances, checklists, processes and what-nots to make sure the deliverables are produced with expected level of quality.
Data gathering and Data analysis are two important aspects of planning for quality.
Data gathering involves using tools such as benchmarking and brainstorming.
The former is done to compare identified process activities with those with similar projects, or projects from similar verticals. The idea here is to identify the effective and proven best practices that can be used on the project. The latter is part and parcel of the whole planning exercise – with brainstorming we look at things pragmatically and adopt only those quality processes and practices that make sense for this project.
We also gather data related to quality planning by interviewing specific stakeholders, key quality team members from other projects, subject matter experts and so on.
Once the data is collected we analyze them to come up with planning decisions. Here are some of the analysis tools and techniques –
Cost-benefit analysis
This is about comparing the cost of performing each quality activity and the benefits it provides. At the end of the exercise you could decide which activities to include, as well as priorities of them – so that performing these activities will provide maximum benefit to the project.
The primary advantages of this analysis is reduced rework, higher productivity, lower cost and increased stakeholder satisfaction – which is priceless, actually. You can also see that most of these are indirect benefits unlike the effort on development activities produce. However, all effort related to quality produce indirect benefits. Benefit of not having defects is what you get for the effort.
Cost of quality (CoQ)
Cost of activities to ensure conformance to requirements, and cost arising out of non-conformance of produced deliverables to the requirements is the Cost of Quality. Again, Pareto’s 80-20 rule is applicable here as well – 80% of the issues are due to 20% of the reasons. If these 20% reasons are identified and addressed upfront, the returns on investment on quality activities will be realized up front.
CoQ involves two aspects –
Cost of conformance – prevention costs (build quality product) and appraisal costs (assess quality of product).
Cost of non-conformance – internal failure costs (defects identified by project team) and external failure costs (defects found by end customers).
Here’s a quick look at the reasons and impact of these causes –
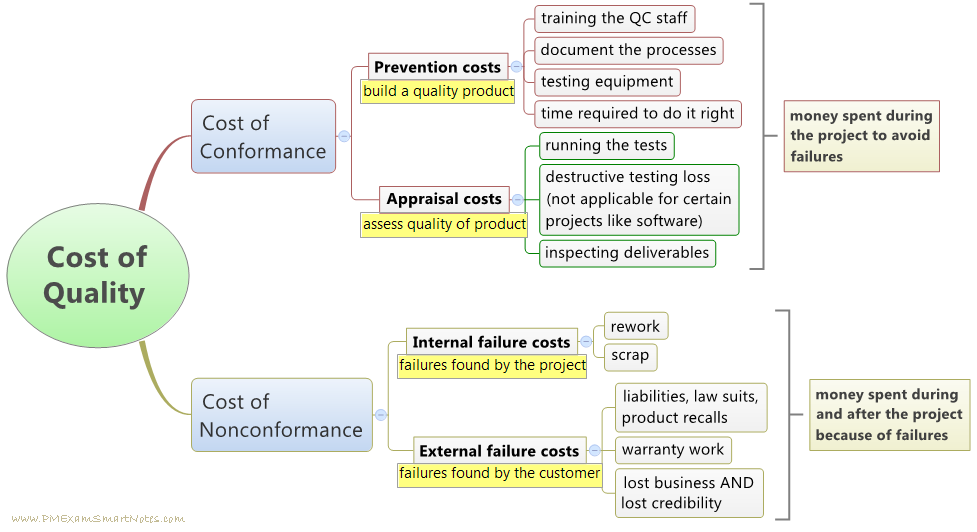 Figure 1: Cost of Quality – reasons and impact
Test and Inspection planning
This is where the project manager, quality team, and experts sit and decide how the deliverables are tested and inspected to ascertain that they meet expected quality measures such as performance, reliability, maintainability, and so on. Unless this is understood and documented, it would not be possible to showcase to the customer that the deliverables indeed measure up to their quality expectations.
The type of tests depend on the industry (inspection in manufacturing, field test in engineering, strength test in construction and so on). This planning also determines the unit of measurement and acceptable values.
This becomes an important aspect for the success of validate scope process where customer accepts deliverables and signs off.
Benchmarking
We say this earlier too. This indicates the practice of comparing another project of similar type and nature from the past to the current one to identify processes or practices, or even to find better ways to do things.
This method is typically used in industries where testing is destructive in nature and/or leads to additional cost – such as inspecting nails, or inspecting ready-made shirts.
Sample sizes and frequency of tests are determined during Plan Quality process so that cost of quality will consider amount of scrap and number of tests.
Design of experiments (DOE)
DOE is used to figure out the number and types of tests and impact of their output on cost of quality. This is a statistical method. Each of the several identified tests are performed many number of times and the results are statistically analyzed to identify which of the tests help measure quality of deliverables most accurately.
Statistical sampling
Statistical sampling is a sampling technique where a representational sample is picked from the population and this sample is thoroughly tested using the designed tests. If number of defects found cross the acceptable limit in this sample, entire population is rejected.
For instance, out of 10000 shirts (population) a batch of 100 shirts is randomly selected. Each of these shirts are tested for manufacturing defects. If the threshold is say 3 shirts, then 3 defective shirts at the most are allowed in this batch of 100 shirts. If more than 3 defective shirts are found, then entire population of 10000 shirts are rejected.
 Figure 7: Statistical sampling flow
This method is typically used in industries where testing is destructive in nature and/or leads to additional cost – such as inspecting nails, or inspecting ready-made shirts.
Sample sizes and frequency of tests are determined during Plan Quality process so that cost of quality will consider amount of scrap and number of tests.
What is produced here?
Quality management plan
This describes how the project implements performing organization’s quality policies and methodologies. This plan defines,
- how quality is measured on the project,
- what quality control and assurance activities are conducted and when they are conducted,
- what are the acceptable quality standards.
Quality metrics
Robin Sharma in his book The Greatness Guide says, ‘what gets measured gets improved’. Quality metrics is that WHAT of the product that you need to measure in order to improve its performance.
For instance, let us say that in a statistical sampling exercise you figure that 12% of shirts on an average are defective. This is a great measure, because it sets you thinking to further dig and find the source of the issue. Your quality control team tells you that 80% of these defects are due to improper stitching of buttons or button holes. You have drilled down the reason to be around the buttons. Now you dig into the automated process that stitches buttons on the shirts. This way you can drastically reduce the defects, and corresponding costs of nonconformance that we saw in cost of quality.
Then again, what gets measured gets improved.
Updating required project documents and plans
This may be required whenever you find that some impacted document needs updates due to this quality plan exercise. The risk management plan, requirements management plan, scope baseline. Documents such as lessons learned register, risk register, stakeholder register, requirements traceability matrix and so on – the thumb rule is most of the input documents that are studied may be improved or refined based on discoveries or changing needs.
Plan Quality is quite an exhaustive process and usually done along with QA lead, and with help from performing organization’s quality assurance team.
If you have worked in smaller companies or start-ups like I do, you might have found that you need to start on some of the activities on your own without much help from organizational process assets. You may even end up preparing the quality plan that sort of becomes the organizational quality policy for other projects to follow. Share your quality planning experience in the Comments section below.
With planning behind us now, let us look at how manage quality process works.