“If you don’t have time to do it right you must have time to do it over.”
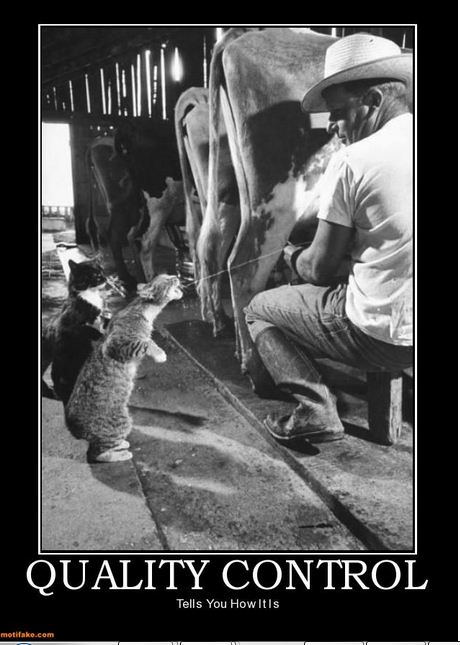
-John Wooden
The main goal of a project is to produce a product, service or result. Quality control project management activity is the one where the team verifies whether the project is producing what it is intended to, adhering to the accepted requirements and to the expected quality standards.
Quality control is about testing the deliverables to find any defects. If and when a defect is found you find the root cause of it and,
- fix the defect (which may need you to raise a change request),
- ensure that the root cause is addressed so such defects will not occur in future.
This project management activity is all about using statistical tools. The following concepts are something that the quality control team should be aware of.
Prevention versus Inspection
Prevention is about taking proactive action to ensure defects are not introduced in the product. Creating check-lists, training people in testing methods, creating effective test plan – these are all preventive acts.
Inspection is about examining deliverables with intent to find any defects, or deviations from documented requirements, so that customer gets the deliverables that implement given requirements. Quality control activities are conducted from this perspective.
Attribute Sampling versus Variables Sampling
First let us understand what is meant by ‘sampling’.
Sampling is a statistical technique of assuring quality where a subset of large population is selected and certain characteristics are closely examined on that subset. If the characteristics meet specified standards then entire population is certified to be good, else entire population is rejected. Advantage of Sampling approach is that it reduces quality testing time and lowers quality assurance cost.
Now, Attribute sampling is the case of sampling where population is accepted if characteristics met specifications exactly; if they didn’t the population got rejected.
Variables sampling is the case where the degree to which characteristics matched specifications is measured. The population is accepted only if they matched to a certain degree of conformity. In other words, tolerance is introduced. In Attribute sampling tolerance is zero – characteristics either matched, or they did not.
Tolerances versus Control Limits
We saw the introduction of tolerance in previous paragraph. Tolerance indicates a range of deviation within which the results are accepted. Control limits are the thresholds of deviation beyond which the process is termed as ‘out of control’.
What do I need to test project deliverables?
Project management plan
By now you might have come to expect what goes in from project management plan for this process. Yes, the Quality management plan.
Quality management plan refers to organization’s policies related to quality, and contains the following information –
- how quality is measured on the project
- what quality control and assurance activities are conducted, their frequency and duration
- acceptable quality standards
Project Quality Metrics
A project quality metric refers to its attribute that is to be measured, and also how it is to be measured. A quality metric measurement is the actual value of this metric.
For instance, tire-alignment is an attribute of the car and a quality metric for it defines how to measure tire alignment, including tolerance limits. Metrics help you verify quality against requirements.
We’ll also need the outcome of quality assurance (manage quality) activities – test and evaluation documents, and lessons learned register (always helps to know how our ancestors handled things 🙂 ).
Schedule performance and cost performance data, quality metrics and such performance data is needed as well.
Deliverables and Approved change requests
Two things that need to be verified on a project are – deliverables and change requests. Deliverables are what the project produces. QC (quality control) team needs to check quality of deliverables against documented requirements.
Certain change requests are part of the deliverables based on their status in change control list. Whichever have been approved by the change control board and planned to be delivered, need to be verified by the QC team in this process.
Every organization has some process assets such as quality guidelines, policies, standards, issues and defect reporting methods that need to be considered for the process.
How do I do it?
What tools and techniques one uses is dictated by variables such as industry, type of the project, customer insistence, and organizational policies and practices.
Inspection
Inspection is a non-intrusive way of verifying quality of a finished product by formal evaluation exercise against documented standards. This is mostly a manual exercise. Specific attributes to test and the method of inspection are understood from the Quality management plan.
Inspection is used to validate deliverables as well as defect repairs, which might come as a result of implementing change requests.
Again, data is key here just like we saw in manage quality activity. Data collection, data analysis, and data representation.
Data gathering tools
Checklists
A checklist continuously gets refined as project progresses. A good quality checklist will help to verify quality of the product to a large extent. It is a structured list of predefined checks that help you to confirm that deliverables meet requirements. Certain industries have standard checklists.
Checksheets
Checksheets are also called tally sheets. These are good to use as a check list to collect information and group them together. While inspecting deliverables checklists are useful to make sure all attributes are verified.
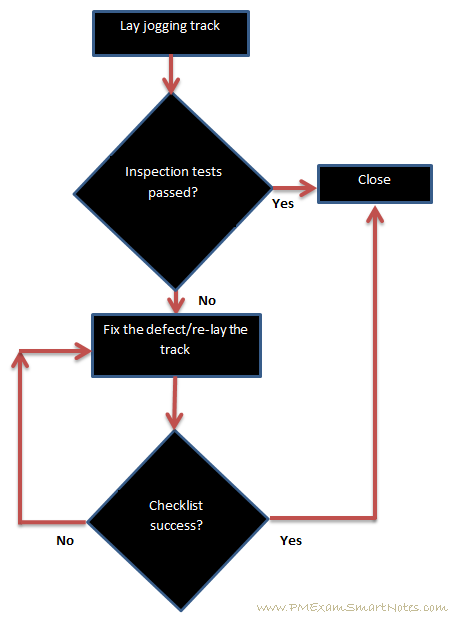
Statistical sampling
Statistical sampling is a sampling technique where a representational sample is picked from the population and this sample is thoroughly tested using the designed tests. If number of defects found cross the acceptable limit in this sample, entire population is rejected.
For instance, out of 10,000 shirts (population) a lot of 100 shirts is randomly selected. Each of these shirts are tested for manufacturing defects. If the threshold is say 3 shirts, then 3 defective shirts at the most are allowed in this lot of 50 shirts. If more than 3 defective shirts are found, then entire population of 10,000 shirts are rejected.

Statistical sampling flow
Data analysis tools such as root-cause analysis and performance reviews are used to collect relevant insights into how efficient quality activities are.
Data representation techniques
such as..
Cause-and-effect diagram or Ishikawa diagram or fishbone diagram
These are also called Ishikawa diagrams or fishbone diagrams, as we saw in Identify Risks process. This is a popular root cause diagram, where a root of a cause of problem can be traced by continuously trying to answer ‘why’ along each of the lines of symptoms.
Refer to the diagram below. Wrong measurements are one of the symptoms of Jogging track defects. And asking “why” has led to identifying that calibration of tools has been the root cause of this issue.

Fishbone diagram
Flowcharts
Flowcharts are used to show relationship between steps in a processes. Activities, decision points and order of processing are main constituents of flowchart. They can unearth potential problems in quality processes and help plug any gaps.
Simple flowchart
Histogram
This is a graphical representation of distribution of data, shown as vertical bars representing characteristics of problem. The y-axis can show probability of the characteristic happening during problem situation, or simply the number of times this characteristic materializes during the problem situation.
Scatter diagram
Also called Scatter Plot or Scatter graph is a type of mathematical diagram using Cartesian coordinates to display relation between two variables. One would be dependent variable and the other independent variable. Y-axis is used to plot the variable to be predicted (dependent variable) and X-axis is used for the variable to make prediction (independent variable).
Correlation refers to the degree of relationship between two variables. Degree of correlation can be found out looking at the plot. If the points are fairly random then correlation between variables is less (or ‘null’). If pattern of dots slope from lower left to upper right then it is called ‘positive’ correlation, and if pattern of dots slope from upper left to lower right then it is called ‘negative’ correlation.
An example of Scatter diagram is plot of two sets of variables, one representing height of an athlete (independent variable, on X-axis) and another representing weight (dependent variable, on Y-axis) – to find whether height has any correlation with weight of an athlete.

Scatter Diagram
As you can see, there is a ‘positive’ correlation between these variables. It appears that as height of an athlete increase she tends to weigh more.
Review of approved change requests
Just as deliverables, approved change requests too are verified for intended quality as per the guidelines from Quality management plan.
For Agile projects the retrospective meetings help identify lessons learned, and the whole iteration activities are analyzed to understand,
- what went right,
- what did not go well, and
- what needs to be improved.
What do I produce in this activity?
Whenever data is collected and analyzed, it helps us create useful information (which are then expressed as reports).
Measured values of Quality metrics
All QC measurements are documented in the format specified in Quality management plan. These form inputs to Perform Quality Assurance process.
Verified project deliverables!
The most important outcome! Deliverables and changes both go through quality control process and rejected changes will go back to execution phase.
These deliverables go next to customer so they can validate scope and accept (hopefully!) the deliverables.
Change requests
As with any monitor and control process, changes may be discovered during this process to, say, project management plan itself. In such cases a change request is raised that goes through change control board via Perform Integrated Change Control process.
And then of course you update any plans and project documents used in this process – because either you found some discrepancies or found a genuine need to change/update them.
With this now we’ve completed project quality management study! Congratulations, treat yourself to a hot cuppa coffee (or whatever beverage you enjoy 🙂 ).
Let us now see what we do in resource management – activities that move the wheels of the project, so to speak.