In the previous post of this series we looked at Data Gathering Techniques used across all the processes we need to study for PMP exam.
What do you do once you gather data?
You analyze them in a specific context and turn into Information.
In this article let us look at the next group, Data Analysis techniques.
Group 2A : Data Analysis techniques
Data analysis tools give perspective to the raw project data, which helps the project manager make decisions on the project.
There are 27 data analysis techniques we need to study for the PMP exam, and of course to manage our projects better. Given the number of techniques we will split this article into two posts.
In this post we shall look at these important Data Analysis techniques –
- Alternatives analysis
- Assessment of other risk parameters
- Assumption and constraint analysis
- Cost of Quality (CoQ)
- Cost-benefit analysis (CBA)
- Decision tree analysis
- Document analysis
- Earned value analysis (EVA)
- Influence diagrams
- Iteration burndown chart
- Make-or-buy analysis
- Performance reviews
- Process analysis
Some of these are easy to perform and some are difficult to master.
However from the exam perspective, first – you need to understand each of these techniques. Second – you need to understand which process uses them so you get the context.
By knowing the first, you will be able to make more sense when you study it in the context of the process that it appears in.
This prepares you to answer ITTO based questions easily.
And this series of articles helps you do both.
Grab a cup of coffee, and let’s get started!
Data Analysis technique #1: Alternatives analysis
 Most of the decisions can be arrived at by identifying alternative approaches to solve the problem. Alternatives give us the opportunity to weigh in pros and cons and choose the ones that solve the problem most effectively.
Many a decisions can be taken by using gut feel to analyze the alternatives.
Some take more than that and need the use of advanced techniques such as Multi-Criteria Decision Analysis.
In its simple form Alternatives analysis contains these steps –
- Identify the problem
- Note down the alternatives to arrive at the solution
- Identify evaluation criteria for each of these alternatives
- Conduct market research for each of the criteria, and/or have numerical rating. You can also apply techniques such as cost-benefit analysis.
- Recommend solution based on the alternative that scores high
Let us take an example to understand this –
Step 1: Identify the problem
Proof-of-Concept prototype to be created to win a new project. This PoC uses latest technology stack, which reduces overall solutioning effort and offers better performance. The in-house architect or developers have not worked previously on this new technology stack.
Step 2: Note down the alternatives to arrive at the solution
- Alternative #1 – team up solution architect and a senior developer
- Alternative #2 – get a specialized external consultant that is familiar with tech stack, and team up with a senior developer
Step 3: Identify evaluation criteria for each of these alternatives based on priority
- Eval criteria #1 (priority #1) – experience gained through this PoC which can be useful in winning and running other similar projects
- Eval criteria #2 (priority #2) – time taken to come up with the PoC
- Eval criteria #3 (priority #3) – overall cost for the prototype as well as project (if we won the contract based on the PoC)
Step 4: Conduct market research for each of the criteria and apply techniques such as cost-benefit analysis
| Eval / Alternatives | Experience | Time | Cost | Overall | Winner? |
| Alternative #1 | Complete in-house experience. Can be used for current & future projects. | Takes more time due to additional time taken to learn the new tech stack and develop PoC | $4500 (one month with in-house people) | Advantage on Experience & Cost | Winner |
| Alternative #2 | Limited advantage as main architect is an external consultant. | Takes lesser time than alternative#1 | $9000 (3 weeks with the expert consultant) | Advantage on Time | NA |
Step 5: Recommend solution based on the alternative that scores high
Alternative #1 uses in-house architect and senior developer. The advantage of knowledge gain in-house along with the possibility of pre-assignment to the project will reduce overall project cost.
Alternative#2 does not score on both these factors, and increases the risk of external consultant becoming single point of failure during the project.
Considering these, the decision is to go with in-house architect (although he has not worked on the new tech and will take more time to complete PoC) and senior developer combination.
I know, you must be thinking there must be plenty of processes that use this. You bet. Here they are –
- Monitor and Control Project Work
- Perform Integrated Change Control
- Plan Scope Management
- Define Scope
- Plan Schedule Management
- Estimate Durations
- Plan Cost Management
- Estimate Costs
- Manage Quality
- Estimate Activity Resources
- Control Resources
- Perform Quantitative Risk Analysis
- Monitor Stakeholder Engagement
Data Analysis technique #2: Assessment of other risk parameters
Well, this is more like a checklist item, honestly. Or maybe you can use one for this technique.
This technique is used only in one process – yes, you guessed it, Perform Qualitative Risk Analysis.
In essence, this technique is about analyzing other parameters than just the Probability and Impact of a risk.
Which are they?
- Controllability – the extent to which one can control the outcome of a risk
- Connectivity – the extent to which current risk is connected with other project risks
- Detectability – the ability to detect a risk when it materializes or is about to materialize
- Dormancy – the duration after a risk is materialized that its impact is discovered
- Manageability – the ability to manage the impact once a risk materializes
- Propinquity – the extent to which a risk impact is perceived by stakeholders. Propinquity is low if risk is considered to be non significant.
- Proximity to project objectives – the duration from the point or risk materialization to the point when it impacts one of project objectives
- Strategic Impact – the potential for the materialized risk to impact one or more of strategic objectives of the project
- Urgency – the duration from point of risk materialization in which risk response strategy must be applied to manage the risk.
Also Read: How to calculate Critical Path and answer questions on this topic on the exam
Data Analysis technique #3: Assumption and constraint analysis
 This again is one off technique that is used only in Identify Risks process. At least as per PMBOK’s suggestion, that is. As a project manager of course we can make use of this wherever it makes sense to.
Every project works under certain constraints. And no plan has 100% certainty and so they are made under certain assumptions. Both these – constraints and assumptions – are made during project plan and/or project estimates.
Simply by revising these documents we may figure that,
- Some of the constraints are no longer applicable. This may lead to positive risks (opportunities) and reduce costs, relax schedule, or benefit in other ways.
- Some of the assumptions are no longer valid and so can be removed. Again, these may be beneficial to the project and help achieve project objectives in a better way.
- Some new constraints and/or assumptions could be discovered, which would unearth new risks or secondary risks.
Data Analysis technique #4: Cost of Quality (CoQ)
 This is an important technique to analyze the cost of quality activities – both of doing and not doing right set of activities.
Here’s what it means –
Cost of Quality consists of Cost of Conformance and Cost of Non-conformance.
Cost of Conformance
Again, here there are two categories that we can plan activities under –
Prevention costs
This is the cost of activities required to prevent defects and failures getting into the product as it is developed.
-
- establishing specifications of raw material, processes, deliverables
- create and maintain quality assurance system
- training people to work effectively to produce quality product
- equipment needed for conducting tests
- creating plans for quality, production, inspection
Appraisal costs
This is the cost of activities conducted to test whether the product adheres to the agreed upon quality standards and requirements.
-
- checking the raw material and processes against defined specifications
- testing the deliverables
- inspection
- quality audits
Cost of Non-conformance
Internal failure costs
Costs associated with fixing the deliverables after defects are found internally by the testing team.
-
- failure analysis
- rework required to fix issues found
- scraping the deliverables if defects/issues cannot be fixed
- waste generated during rework
External failure costs
Costs associated with repercussions after defects are found by the customer. This is the most expensive type of cost – both tangible and intangible.
-
- repairs or service
- warranty claims
- complaints
- product returns
- credibility of the company
- loss of repeat business
Here’s a mind map that outlines this concept (click and download) –

Cost of Quality technique is used in the following processes –
Ad: Are you wondering how to go about 2021 PMP exam prep? You can now get certified in next 6-8 weeks.
Stop worrying! Take this smart way to pass the new 2021 PMP® exam, using one of the best PMP plan –
- PM Exam Last Mile prep program – learn the rock solid foundation and the ‘predictive’ part (AND the free strategies course) – with support for PMI application & same-day support for content queries!
- Cornelius’s PMP® booster program – top up your study with the ‘agile-hybrid’ content needed for the new exam
- The 2021 PMP® Simulator – take the dry run, practice time management, use analytics to hit the required threshold!
– OR –
Data Analysis technique #5: Cost-benefit analysis (CBA)
 Cost-benefit analysis is a way of evaluating alternative options to identify one that has the least amount of cost while providing the best way to achieve the benefits.
This is also called Benefit Cost analysis.
💡 Exam point: CBA or BCA could be represented as a ratio in the question. For a project to be profitable, CBA ratio (cost/benefit) should be < 1 and BCA (benefit/cost) ratio > 1
This technique can be used to solve different problems such as choosing the best way to test a product, choosing the best risk mitigation strategy, choosing the best project among different opportunities and so on.
The cost will have long term repercussions, right? What about impact of inflation on budget, for instance?
That’s the reason when the CBA is calculated from a long term perspective, you look at time value of money. By converting future expenses into present value.
In it’s simplest form, Benefits – Costs = Net Present Value (NPV)
If NPV is positive then the undertaking is a profitable one, and if it is negative then it is unprofitable one.
In the context of quality management, CBA is used to find which quality activity gives the best results.
When used during project initiation stage, CBA is used to see if the project is a profitable venture. The present value of all the costs and present value of all the benefits are calculated in monitory figure and then the above formula is applied to see if the project would be profitable.
CBA can also be used for making make-or-buy decision.
When used in the change control process, CBA helps decide whether the proposed change request is worth implementing.
Which processes are using this, again?
- Monitor and Control Project Work
- Perform Integrated Change Control
- Plan Quality Management
- Control Resources
- Plan Risk Responses
Data Analysis technique #6: Decision tree analysis
 Again, this is a data analysis technique that is used to find the best among several alternative scenarios. Best in terms of meeting project objectives.
Typically used in the context of risk analysis this technique helps show various available decision paths passing through one or more decision points.
As you can see each decision point may create more than one path (or branch, in the parlance of tree), and with multiple decision points the overall number of decision paths can grow exponentially.
Most effective decision path is calculated based on expected monitory value of each of the paths and the one with most Net Path Value will be chosen.
Decision tree has three types of nodes:
- Decision node – represents a decision. Shown with a rectangle. Decision is written inside this rectangle.
- Chance node – represents uncertainty associated with this decision. Could lead to a payoff or cost. Shown with a circle.
- End node – end of path. Shown with a triangle.
Here’s an example of Decision Tree, click here for the complete example that is used to draw this decision tree.
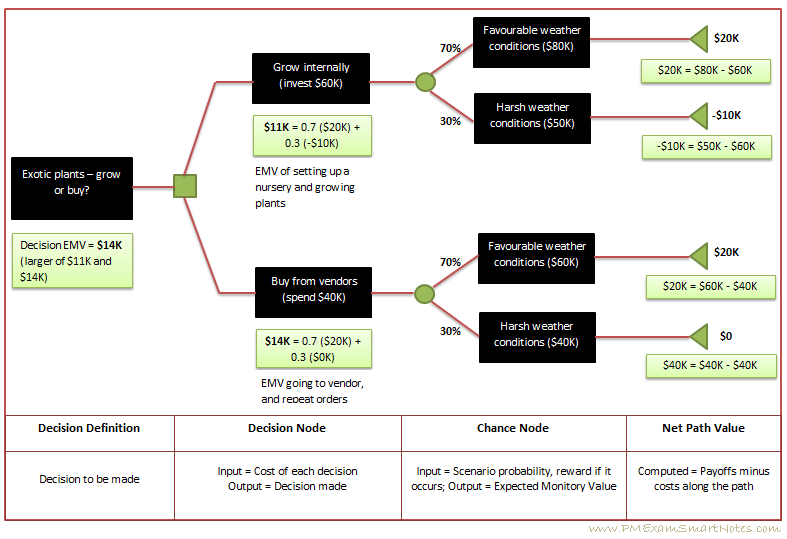 Decision Tree Analysis
The process that uses Decision Tree Analysis is Perform Quantitative Risk Analysis.
Data Analysis technique #7: Document analysis
 Document analysis is what the name says – analyze the documents in order to get relevant information needed for decision making.
As an example, in Collect Requirements process some of the documents that are used for analysis are –
- Agreements
- Business plans
- Process flows
- Issue logs
- Organizational policies
- Regulatory documents
- Request for proposal
Not all that exotic this technique, is it? 🙂
The processes that use this technique are –
- Close Project or Phase – predominantly used for updating lessons learned register with all that has been learned in the project or phase.
- Collect Requirements – various documents as given in above list to understand requirements
- Manage Quality – here the reports coming from control processes – such as test reports, performance reports, and variance analysis reports – are going to be analyzed to ensure the deliverables meet quality requirements
- Identify Risks – as the process name suggests the idea here is to identify as many project risks as possible, and the documents that can help are various plans, agreements, project charter, business documents, technical documentation, requirements documentation and so on.
- Identify Stakeholders – as you know this is one of the initial processes executed on the project. At this time there are just a few documents available – business case document, project charter, benefits management plan, and of course lessons learned register. Analyzing these will help identify key stakeholders.
Data Analysis technique #8: Earned value analysis (EVA)
 Earned Value analysis is a technique using 3 main project constraints – Scope, Schedule, and Cost – to have a single measure of project performance.
In the context of Earned Value management, the combination of approved Scope, Schedule, and Cost to give a measure of project progress is called as Performance Measurement Baseline (PMB).
Referring to the image below, here’s how we go about measuring project performance –
1. In the S-curve that you draw, PMB shows you the Planned Value of the project (cumulative) on any given day. The project progress is measured against PMB for that day, which tells us if there is a variance and whether it is positive.
2. That is, for a given day, PMB gives you the Planned Value. From the actual spending you know the Earned Value (that is the work completed and it’s value earned). EV – PV gives you Schedule Variance. If you have earned more than planned then you are ahead of schedule, else behind.
3. Similarly, looking at the money spent to complete that much work (for which you calculated EV), you will get Actual Cost figure. And the formula EV – AC will tell you Cost Variance. Again, if it is positive your project is within budget, else it it not.
Simple, isn’t?
Of course the execution of EVM is not, but the concept behind is simple to understand. Which is what we need for the exam right now.
Here’s what it looks like, and you can study Earned Value Analysis in detail in this post –

Control Costs is not the only process where Earned Value Analysis is done. Here’s the entire list –
Also Read: Hands-on review of the top PMP study course I used to prepare for my PMP exam
Data Analysis technique #9: Influence diagrams
 Influence diagrams are plotted to show relationship between variables involved in decision making process – in the context of uncertainty that is inherent.
Influence diagram uses shapes to show area of uncertainty (oval), decisions or choices (rectangle), desired outcome (octagonal), and influences between them.
This technique is used in Perform Quantitative Risk Analysis process.
Risks develop from uncertainties in the project and Influence Diagram help you take better decisions in the face of uncertainty.
Understanding this will give you insights into decision making process because you now understand which variables impact more the overall outcome of decision.
For complex scenarios, once the influence diagram is created it can be evaluated using simulation technique such as Monte Carlo analysis to indicate the elements that have highest influence on outcome.
Here’s a simple Influence diagram used for making a decision about vacation –

Influence Diagram (image courtesy wikipedia)
Data Analysis technique #10: Iteration burndown chart
 This is primarily used in Agile projects as a means of visually measuring project progress, by looking at how much work still remains to be completed in the iteration.
Burndown indicates ‘remaining’ work effort. By the way, this could be remaining ‘story points’ as well, but that’s for another ‘agile discussion’.
Thus at the beginning of the iteration the total planned work effort is plotted on the y-axis (x-axis being the timeline). A straight line joining this point to x-axis on last day of iteration shows the ideal burndown line.
This straight line ideal burndown line assumes that the amount of work planned for each day is completed on the day. In other words it assumes same ‘daily velocity’.
This of course we know this isn’t how it works on the project.
Life happens on the project.
So, we plot actual burndown ‘curve’ (not a line in 99.9999% cases 🙂 ) by plotting remaining work at the beginning of each day and joining that point with previous day’s remaining-work point. This is the actual burndown line.
The graph below shows a sample Iteration breakdown chart –

Iteration burndown chart (image courtesy wikipedia)
Can we get something more from the chart?
Of course.
The difference in work hours between ideal burndown line and actual remaining work on any given day gives us the variance as on that day. This would tell us whether we are ahead of schedule or behind.
By taking average daily burndown velocity of previous days we could plot a link and extend it to hit x-axis – that would be our forecast burndown.
The only process where is tool is used is Control Schedule.
Data Analysis technique #11: Make-or-buy analysis
 This is a technique used in Plan Procurement Management process to decide which aspects of the project should be outsourced and which should be made in-house.
This is typically used in conjunction with Cost Benefit analysis for making objective decisions.
Some of the reasons to buy rather than make are –
- no in-house knowledge
- no in-house infrastructure support
- economical to purchase from outside
- more risky to get it done in-house
- lack of time
In some cases the decision is easy to make. In some cases some analysis and objective reasoning is necessary to arrive at a decision. Cost-benefit analysis of alternatives considering pros and cons of each approach would help.
Data Analysis technique #12: Performance reviews
 Again, this is similar to reviews.
You look at performance figures and compare it against expectations as in the case of schedule performance compared against schedule baseline in Control Schedule process.
In this case some of the parameters you look at are start and end date of activities, percent complete, and remaining duration for activities in progress.
The processes that use this technique are –
Yes, these are all control processes that make use of performance reviews technique.
Data Analysis technique #13: Process analysis
 Similar to document analysis, process analysis is all about analyzing a quality process to –
- identify scope for improvements
- examine existing problems and/or constraints for smooth running of the process
- identify non-value-adding activities that are draining resources without any benefits
The only process, as you might have guessed now, that uses this technique is Manage Quality.
Summary
Phew! Yes, these are quite a bit of concepts that are sprinkled across various processes.
When you understand these in their standalone format and in the context of processes that they appear in, the insights you get is invaluable.
This not just helps you answer ITTO questions on the exam, but help implement them – at least consider using them – on the project.
There are another 14 more Data Analysis techniques we will look at.. in the next post!